

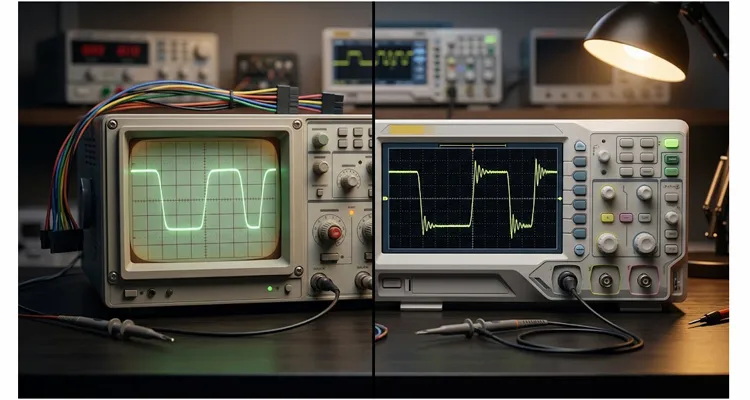
In March, a North American commercial vehicle ECU supplier sent us a 42-second capture. The bus ran 500 kbit/s J1939, twelve nodes, 8.2 meters of twisted pair, with 120 Ω termination at both ends. By the time we saw it, the customer had already replaced two transceivers and rewritten the driver. The 50 MHz oscilloscope trace looked clean. The 100 MHz scope trace showed a 620 mV negative ring lasting 38 ns, sitting 112 ns after the dominant edge. That ring landed directly on the sample point.
The firmware was not the cause. The 50 MHz oscilloscope front end had filtered the evidence out of the trace.
The engineer had been chasing intermittent error frames for eleven days. Once we could see the CAN bus ringing, the fix took four hours: a stub line on one node had to be shortened from 30 cm to under 10 cm. This is a recurring signature in our failure analysis work, on J1939 benches, industrial control cabinets, and CAN FD validation setups. The scope says the signal is fine. The protocol analyzer says the bus is erroring. The engineer does not know which instrument to trust.
In most of these cases, the limiting factor is not the scope brand or the probe alone. It is the analog front-end bandwidth.
What the 50 MHz trace hid
A 50 MHz oscilloscope does not simply miss high-frequency content. It attenuates it. The front-end amplifier rolls off at -3 dB at 50 MHz and then more steeply beyond that. What reaches the ADC is a low-pass filtered version of the real edge.
How a 50 MHz front end filters the edge
On a classic CAN bus, a transceiver might produce a 10–90% rise time of 25 ns. That edge contains meaningful spectral energy up to roughly 0.5 divided by the rise time, which is about 20 MHz. A 50 MHz oscilloscope can show the edge shape, but it cannot show the fast CAN bus ringing that follows the edge. That ringing is not random noise. It is a deterministic reflection from an impedance discontinuity: a missing termination, an excessive stub, a connector mismatch. In our lab, we treat the scope front end as part of the measurement circuit, not as a transparent window.
Why the ringing frequency depends on stub length
For a 30 cm stub on a typical twisted pair, the CAN bus ringing often sits in the 100–200 MHz range. A 50 MHz oscilloscope does not just reduce its amplitude. It removes it from the displayed trace. The filter is doing what it was designed to do. The problem is that the engineer reads the filtered trace as ground truth.
On our 1.5 meter sample harness, a 25 cm stub shifted the ring frequency from 180 MHz to 95 MHz. The 50 MHz oscilloscope attenuated the 95 MHz component by more than 20 dB. That is why the edge looked smooth. That is why the error frames looked like a mystery.
The comparison table we use in the lab
The table below comes from measurements on the same node, same probe, same trigger conditions, different scope bandwidths. The probe was a 200 MHz passive probe with a short ground spring. The bus was 500 kbit/s. The transceiver was a standard high-speed CAN part.
What the table shows about CAN bus ringing and rise time
| Observable | 50 MHz scope | 100 MHz scope | What the bus is actually doing |
| Rise time measurement | 80–120 ns, artificially stretched | 35–50 ns, accurate within probe limits | 25–35 ns, per transceiver spec |
| Ringing after falling edge | Not visible or barely visible | 500–800 mV peak-to-peak, 30–60 ns duration | Real, and crossing the sample threshold |
| Overshoot amplitude | Underreported by 60–80% | Within 10% of true value | Depends on termination quality |
| Narrow glitch below 50 ns | Smoothed into the edge transition | Clearly resolved as a separate event | EMI coupling or reflection |
| Error frame correlation | Cannot correlate to waveform events | Can trigger on error frames and view timing | The glitch is the cause of the error |
The first row misleads engineers most often. A 50 MHz oscilloscope reports a rise time that looks slightly slow but acceptable. The engineer reads that number and concludes the bus is marginal but not broken. What is actually happening is that the scope front end is dominating the measurement. The bus could have a 25 ns edge, and the 50 MHz oscilloscope will never show it.
For a deeper bench-level breakdown of edge rate, ringing amplitude, and differential voltage on J1939 backbones, our J1939 oscilloscope waveform analysis guide walks through the same measurement sequence on a 12-node off-highway truck.
Why CAN FD made this urgent
In a classic 500 kbit/s CAN frame, the sample point occurs about 1.4 µs after the edge transition begins. The CAN bus ringing from a typical stub reflection has decayed by then. The bus can work even with mediocre signal integrity.
The sample point moves closer to the edge
In CAN FD, the data phase can run at 2, 5, or even 8 Mbit/s. The bit time drops to 200 ns or less. The sample point moves to within 150 ns of the edge. The same CAN bus ringing that was harmless at 500 kbit/s now sits directly on top of the sample point.
We spoke with an engineer at a commercial vehicle OEM last year who described this exactly. Their J1939 bus at 250 kbit/s was rock solid in the field. When they migrated to a CAN FD variant for a new ECU, the same harness started producing Bus-Off events at high engine load. The 50 MHz oscilloscope they used for original validation showed nothing. A 200 MHz scope showed the CAN bus ringing. The harness had not changed. The timing had.
The 10× rule that floats around engineering forums, meaning use a scope with 10× the bit rate, is a reasonable starting point for digital troubleshooting. It is not sufficient for signal integrity work. For a 5 Mbit/s CAN FD data phase, 50 MHz is not 10× anything useful. You need at least 100 MHz. I would argue for 200 MHz if you are doing margin analysis. For a wider industry perspective on selecting oscilloscope bandwidth for CAN bus testing, DigiKey’s technical blog on CAN bus testing also recommends a bandwidth roughly five times the data rate.
What a proper CAN signal integrity capture requires
The probe matters as much as the scope. A 200 MHz passive probe with a long ground lead will introduce more CAN bus ringing than the bus itself in many cases. The ground lead inductance forms a loop with the probe tip capacitance, and that loop resonates. I have measured ground-lead ringing at 80–120 MHz on a 15 cm lead. Use a short ground spring, not an alligator clip.
Probe selection and ground lead discipline
If you are working on differential signals and you care about common-mode behavior, a proper differential probe in the 100–200 MHz range is the right tool. Keysight, Yokogawa, and Teledyne LeCroy all make probes in this class recommended for CAN work.
Sample rate, memory depth, and trigger capability
The scope sample rate also matters. A 100 MHz scope with 1 GSa/s is adequate for classic CAN. For CAN FD, you want at least 2 GSa/s. The memory depth needs to be deep enough to capture a full frame at that rate without dropping samples. A 50 Mpts segmented memory depth on a 100 MHz scope will let you capture the full frame and zoom in on the edge.
Trigger capability is not optional. If you are chasing an intermittent glitch, you need to trigger on it. Edge triggering will not help if the glitch is a narrow pulse buried in the data field. Pulse-width triggering, with a threshold set below 50 ns, is what actually finds these events. I have watched engineers waste days trying to catch a 30 ns glitch with an edge trigger. It does not work.
How I run a CAN signal integrity capture
The procedure below is the one I have refined on customer test benches and in our own validation lab. It is not theoretical. It is what I do when a customer sends a bus that is misbehaving.
- Determine whether you are chasing a protocol problem or a physical-layer problem. If the error counters are incrementing but the bus works most of the time, it is physical layer until proven otherwise. Connect the scope before you open the firmware IDE.
- Set up the probe correctly. If you have a differential probe, use it. Connect the positive lead to CAN_H and the negative to CAN_L. If you are using two single-ended probes, connect them to separate channels and use the scope math function to compute CH1 minus CH2. Keep ground leads as short as physically possible. I aim for under 2 cm.
- Set the time base to show a single bit at a useful zoom level. For 500 kbit/s, 2 µs/div gives a clean view of one bit. For a CAN FD data phase at 5 Mbit/s, you need 100 ns/div or faster. If you cannot see edge detail at this zoom level, you will not diagnose anything.
- Use pulse-width triggering, not edge triggering. Set the trigger to fire on positive pulses narrower than 50 ns, or negative pulses narrower than 50 ns, depending on what you are looking for. This is the single most effective change you can make to your capture setup.
- Capture a long record with segmented memory. Let the scope run for at least 30 seconds. If your scope supports segmented acquisition, use it. You want hundreds of events, not one. The glitch might only occur when a specific relay actuates or a specific motor commutation happens.
- Zoom in on every captured event, not just the first one. This is where 100 MHz bandwidth earns its keep. At 50 MHz, the events look identical. At 100 MHz, you can see the difference between a reflection from a stub and a coupling glitch from an adjacent power line.
- Correlate glitch timing with error frame timing. If your scope has CAN decoding, enable it. If it does not, use the frame timing from your protocol analyzer and line it up with the scope time base. The glitch should appear in the same bit position as the error flag.
- Change one physical variable at a time. Shorten the stub. Add termination. Move the probe. If the CAN bus ringing amplitude changes, you have found the coupling path. If it does not, you are looking at a different mechanism.
- Document the before-and-after waveforms. This is not just good engineering practice. It is what your customer or quality team will ask for when you say the problem is fixed. A scope screenshot with cursors on the CAN bus ringing amplitude is more convincing than a paragraph of explanation.
- Repeat at temperature extremes if the failure is thermal. I have seen CAN bus ringing amplitude change by 40% between 25°C and 85°C on the same harness because the dielectric constant of the insulation shifts with temperature. If you only test at room temperature, you are not done.
Five mistakes I see engineers make constantly
I have been on enough factory floors and customer labs to know the patterns. These five waste the most time.
Mistake 1: Trusting the 50 MHz oscilloscope rise time measurement. The scope is not measuring the bus. It is measuring the bus filtered through the scope front end. A 50 MHz oscilloscope cannot resolve a 25 ns edge. It will report a number, and that number will be wrong. If the displayed rise time is more than about 0.35 divided by the scope bandwidth, which is 7 ns for a 50 MHz oscilloscope, the measurement is dominated by the instrument. You learn nothing about the bus.
Mistake 2: Using an alligator clip ground lead. The inductance of a 10 cm ground lead resonates with probe capacitance at a frequency that can be as low as 50 MHz. That resonance adds CAN bus ringing to your measurement that has nothing to do with the bus. You spend hours chasing a problem the probe created. Use a ground spring.
Mistake 3: Trying to find a 30 ns glitch with edge triggering. Edge triggering synchronizes on the edge. The glitch is not on the edge. It is in the middle of a bit, or during the recessive-to-dominant transition. You need pulse-width triggering. If your scope does not have it, get a scope that does.
Mistake 4: Measuring single-ended and assuming the differential waveform is the sum. CAN is a differential bus. The logic state is determined by CAN_H minus CAN_L. Measuring CAN_H against ground and calling it the CAN signal will miss common-mode shifts entirely. I have seen buses where both CAN_H and CAN_L shifted by 1 V common-mode. The single-ended probes measurement showed a problem that did not exist. The differential probe measurement showed a problem that did. Use differential probe probing or math channels.
Mistake 5: Blaming the transceiver before looking at the harness. The transceiver is usually the last thing to fail. The harness, connectors, stub lengths, and termination are first. I have replaced exactly three CAN transceivers in seven years of doing this. I have shortened stubs, added termination, and replaced connectors dozens of times. For a more detailed treatment of oscilloscope-based automotive bus testing, including eye diagram mask testing and differential probing techniques, Keysight’s application note on automotive serial bus testing covers the full workflow.
How to confirm the fix actually worked
You do not confirm a signal integrity fix by the absence of errors for five minutes. You confirm it by measuring the same parameters that were out of spec before.
Measure the same node, same probe, same temperature
Go back to the exact same node, with the exact same probe setup, at the exact same temperature. Capture the waveform again. Measure CAN bus ringing amplitude at the sample point. If it was 620 mV before and it is now 120 mV, the fix is real. If it is still 400 mV, you have reduced it but not solved it.
Run worst-case conditions and check error counters
Then run the bus under the worst-case condition you can create. If the original failure occurred at high temperature with a specific actuator active, reproduce that condition. Run it for at least an hour. Check the error counters, not just the communication.
If your scope has an eye diagram function, use it. A CAN eye diagram at the sample point shows margin directly. If the eye is closing, the fix is not done. If the eye is open with good margin, you are likely good.
Document the fix in a way someone else can reproduce. I have seen too many fixed buses come back six months later because the person who made the fix did not write down what they changed.
Where our harnesses fit into this picture
We make OBD-II cables, J1939 harnesses, and CAN bus diagnostic cables. We have been doing this for twenty-one years as a direct factory, not a trading company. When a customer comes to us with a signal integrity problem, the conversation starts with the connector and the cable. What is the characteristic impedance? What is the twist pitch? What is the capacitance per meter? These parameters determine whether the harness will ring when it sees a fast edge.
Impedance, twist pitch, and salt spray testing
We mold our own overmolds in-house. For J1939 harnesses, we control twist pitch to 25 mm ± 3 mm and keep characteristic impedance within 120 Ω ± 10%. We run salt spray testing per ASTM B117 for 96 hours on nickel-plated terminals. A CAN harness in an engine bay or under a truck sees moisture, road salt, and temperature cycling. Corrosion in a connector is an impedance discontinuity. It changes the reflection coefficient. It changes the CAN bus ringing. It can take months to show up in the field, which is the worst kind of failure.
PPAP and OEM customization for CAN FD programs
We provide PPAP documentation for customers who need it. For automotive and heavy equipment programs, PPAP Level 3 files are available. This is not a marketing checkbox. The customers we work with need to know the harness they install will not become the reason their CAN bus fails validation.
Our quality system includes ISO 9001, ISO 14001, and IATF 16949. We also work to RoHS, CE, UL, and REACH requirements. Every harness gets a 100% continuity and resistance check before packing. We use a four-step quality inspection process and 5S management. The warehouse is climate-controlled at 22°C ± 3°C and 45% RH ± 10%. We offer OEM customization for logo, brand, length, color, and AWG. If you are designing a harness for a new CAN FD network, we can build it around the signal integrity requirements, not just the pinout.
Questions test engineers ask
Why can I not just use a 20 MHz scope? I have seen people do it.
You can see that the bus is communicating. You can see frame structure. You can measure bit rate. What you cannot see is the signal integrity detail that causes intermittent errors. A 20 MHz scope is fine for asking whether a signal exists. It is not fine for asking why that signal causes errors.
My scope says 100 MHz but the edges still look rounded. Why?
Two possibilities. First, the probe bandwidth. A 100 MHz scope with a 50 MHz probe is a 50 MHz system. Second, the bus itself might have a slow edge. A damaged transceiver or excessive bus capacitance can genuinely produce slow edges. Check the probe first, then check the transceiver.
Can I use two single-ended probes instead of a differential probe?
Yes, if the nodes share a common ground and you are careful about ground lead length. Use the scope math function to compute CH1 minus CH2. Be aware that single-ended probing adds ground-loop inductance that can distort the measurement. For critical measurements, a differential probe is the right tool.
What is the minimum bandwidth for CAN FD?
For a data phase at 5 Mbit/s, I would not use anything below 100 MHz. A 200 MHz scope gives you margin for margin analysis. If you are doing CAN FD at 8 Mbit/s, go higher. The 10× rule is a starting point, not a ceiling.
Why does ringing matter if the protocol layer says the frame is valid?
Because the protocol layer has error detection that catches most problems, but not all. A CAN bus ringing burst that crosses the recessive threshold for 40 ns might not trigger a bit error if it falls in a don’t-care region of the frame. But it reduces margin. When temperature changes, or a different node transmits, that same CAN bus ringing can push a marginal bit over the edge. You are not fixing the problem. You are hiding it.
My error counter is incrementing but I never see error frames on the scope. Why?
Your scope waveform update rate is too low. Error frames are rare. If your scope updates 10,000 waveforms per second and the error occurs once per million frames, you will need to watch for a long time. Use a scope with a fast update rate and segmented memory, and trigger on error frames specifically.
Does termination resistance affect ringing frequency or just amplitude?
Both. The termination resistance sets the reflection coefficient, which determines amplitude. The physical length of the discontinuity, meaning stub length, connector spacing, and cable length, sets the frequency. A missing termination increases amplitude. A longer stub shifts the frequency lower, which can move it closer to your sample point.
How do I measure ringing if I do not have a differential probe?
Use two single-ended probes with short ground springs. Set the scope to compute CH1 minus CH2. Set vertical scale to 200 mV/div and time base to 10 ns/div. Zoom in on the falling edge of a dominant bit. You should see CAN bus ringing as an oscillation that decays over 50–100 ns. If you do not see it, either the bus is well terminated or your probe setup is masking it.
Can I fix ringing by adding capacitance?
Adding capacitance at the node can damp CAN bus ringing, but it also slows the edge and increases load on the transceiver. It is a band-aid, not a fix. The right fix is to eliminate the impedance discontinuity: shorten the stub, fix the termination, replace the connector.
My customer requires PPAP. What does that mean for a CAN harness?
It means documented evidence that the harness meets dimensional, material, and performance requirements. For a CAN harness, that includes characteristic impedance, twist pitch, connector retention force, and environmental performance. We provide PPAP documentation as standard for customers who need it. It is part of how we work.
Talk to an engineer
If you are in the middle of a CAN bus problem that has resisted protocol-level debugging, send us the details. I cannot diagnose your bus from a WhatsApp message, but I can tell you what I would measure first.
If you need a harness designed for signal integrity from the start, not just a cable with the right pinout, we can help. Send the bus speed, node count, stub length, connector type, and temperature range. We will tell you what we would change in the harness before you spend another day on the scope.
We support OEM customization for logo, brand, length, color, and AWG. We provide engineering support from prototype through PPAP. No pricing games, no stock lists. Just engineering.
Contact: https://obd-cable.com/contact/
